Case study: 239 clicks from 61,500 impressions — anatomy of a page-2 CTR collapse
A real 28-day Search Console panel — 0.4% CTR at average position 11.5. Setup, data, diagnosis, and the action plan. Plus the generalizable lesson: most 'ranking problems' indie devs bring me are click-through problems in disguise.
LIPAI WANG · · updated
The setup
An indie-SaaS site, ~18 months old, content-led acquisition, no paid spend. The owner opened Search Console expecting validation and found this panel instead. They sent me a screenshot with the message "is this as bad as I think it is?"
It is, and it isn't. Worth walking through because it is a diagnosis I give often when someone hands me a Search Console tab (our observation, not a tally).
The data
Trailing 28 days, web search type. The panel was taken for this article (first published May 2026), so it postdates Google's September 2025 change to the num=100 results-per-page parameter. Industry analyses report that after that change many sites saw Search Console impressions drop and average position rise while clicks held steady, because rank trackers stopped loading deep results. If you compare this panel with one from before mid-September 2025, expect the older one to show more deep-position impressions and a worse average position for the same real visibility.
| Metric | Value |
|---|---|
| Total clicks | 239 |
| Total impressions | 61,500 |
| Average CTR | 0.4% |
| Average position | 11.5 |
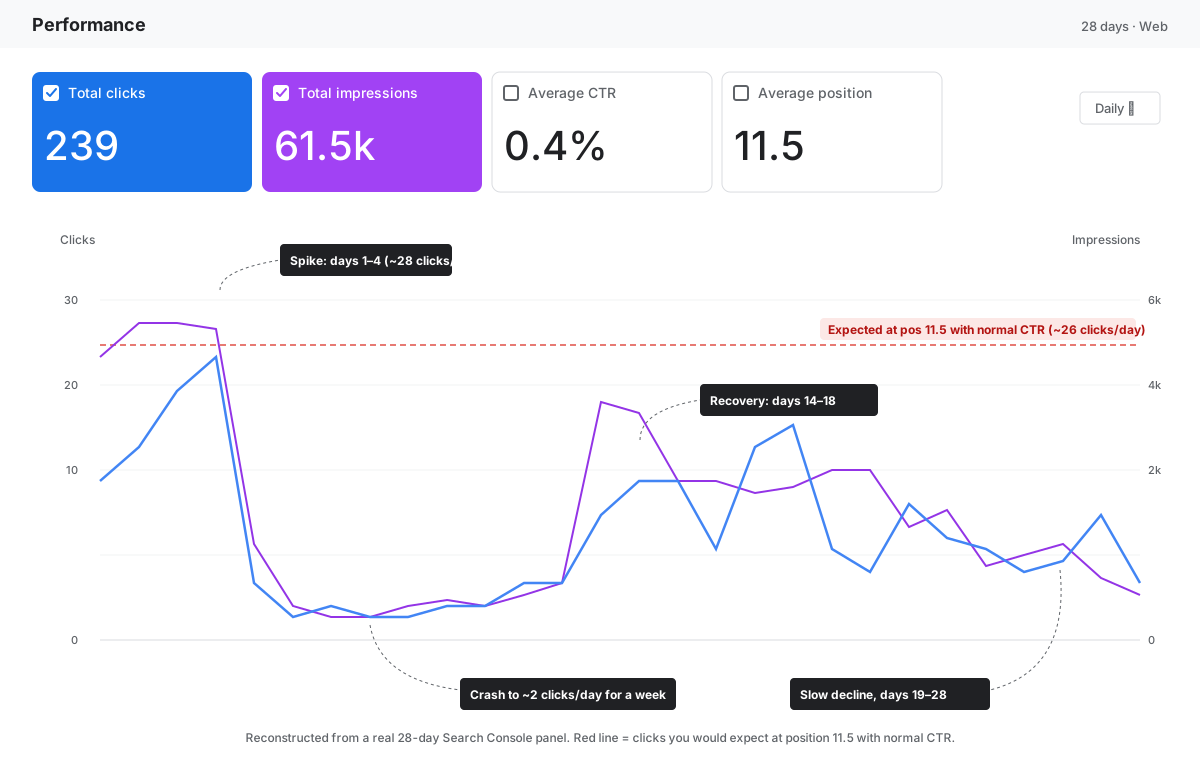
And four things visible in the daily chart above:
- A spike on days 1–4 (~28 clicks/day at peak).
- An immediate crash to 2–3 clicks/day for about a week.
- A recovery on days 14–18 to ~20 clicks/day.
- A slow decline back to ~5 clicks/day across days 19–28.
The instinctive read is "I need to rank higher." That's half right, and it's mostly the wrong place to start.
Diagnosis, in three reads
Read #1: position 11.5 means you mostly live on page 2
Google still ranks results in groups of 10 per page. Average position 11.5 means the typical time someone sees this listing, it's the first or second result on page 2.
The step from position 10 (last on page 1) to position 11 (first on page 2) is a sharp drop. One widely cited study (Backlinko, about 4 million results from Search Console accounts, first published August 2019, updated April 2025) found about 27.6% average CTR at position 1 and only about 0.63% of searchers clicking anything on page 2. The ~2.5% at position 10 and ~1.5% at position 11 in the curve below are our illustrative interpolation, not that study's figures. Benchmarks vary by study and query type, and that study predates AI Overviews; treat these figures as illustrative.
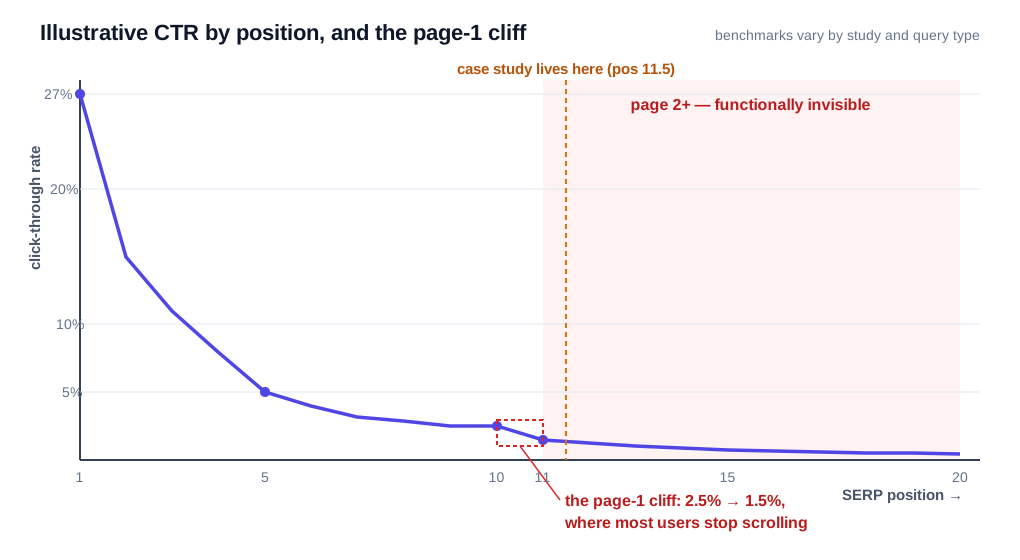
So 61,500 page-2 impressions are functionally invisible. They're "displayed" the same way a billboard behind a building is displayed.
Read #2: even for page 2, the CTR is still ~3x too low
The red dashed line on the chart is the math. At average position 11.5, the expected CTR for an unremarkable listing with no SERP-feature interference is roughly 1.2% (an illustrative benchmark; studies vary). That works out to about 26 clicks per day at this impression volume.
The actual daily clicks line spends almost the entire 28 days under the red reference line. Most days it's at less than a quarter of expected.
- Expected at 1.2% CTR: 61,500 × 0.012 ≈ 740 clicks
- Actual: 239 clicks
- Gap: ~500 clicks left on the table from listing copy alone, not ranking.
Translation: even on the days the listing surfaces above the fold, people are looking at it and choosing someone else. That isn't a ranking problem. That's the listing itself.
Four common causes for listing-level CTR collapse:
The title doesn't echo the query. When a user searches "best AI coding agent 2026" and your title is "A Guide to Autonomous Developer Tools," their eye doesn't pattern-match. They scroll past you. In our observation, title rewrites that echo the user's actual phrasing can lift CTR with no ranking change. Test it on a set of pages against a matched control set before you count on it.
The description is missing or auto-generated. If you don't ship a deliberate
<meta name="description">, Google synthesizes one from your H1 + first paragraph. The synthesized version is almost always less compelling than what you would write on purpose. Google still often rewrites your description, and the description shapes the snippet, not the ranking. But when Google leaves yours alone, a deliberate one is your best shot at the click.SERP features are eating the click before it reaches you. AI Overviews, featured snippets, People also ask, shopping carousels, video thumbnails — all push organic listings down and consume clicks above you. At position 11.5 in a SERP with three rich features, you are effectively at position 18 from the user's perspective. No amount of title polish recovers that; the page has to target a different query.
The page doesn't match the intent behind the query. A how-to page showing for a pricing query gets skipped however good its title is. Read the results that do get clicked, then either change the page to answer what the searcher wants or aim it at the query it already answers.
Read #3: the shape tells you when, not why
The four-act pattern annotated on the chart — spike, crash, recovery, decline — is a fingerprint. It almost always points to one of three things:
- A single high-volume query you ranked for dropped out. The most common cause in 2026: an AI Overview now answers the query, so even position 1 gets a fraction of the clicks it used to.
- You briefly owned a featured snippet and lost it. Snippet wins look like step-changes up; losses look like cliffs down. The crash on day 5 here is consistent with a snippet loss.
- An event or news cycle drove temporary demand that has now faded. Common for opinion pieces, X just launched coverage, anything seasonal.
To figure out which: in Search Console, hit Compare → last 14 days vs. previous 14 days, sort by impression delta descending, look at the top 5 dropped queries. That ranked list is the story. Whatever query dropped most is the answer.
The full diagnosis, in one paragraph
This site has demand. 61,500 impressions in 28 days is not a discoverability problem — Google thinks it's relevant for a lot of searches. What it has is two stacked execution failures: rankings sit just outside the page-1 cliff where clicks would be 5–10x higher, AND the listings that do show up are converting at roughly one-third the rate they should at that position. There's also a specific event in the middle of the window worth diagnosing, but it's a secondary thread.
Action plan: what I'd do tomorrow morning
In order, because the order matters:
Filter GSC for impressions > 1,000, CTR < 1%, position 8–15. This is the highest-leverage list in the entire account. Every row is a page where a single rewrite — title + meta description — may produce a large click gain without any new content or new links. Measure it against pages you leave alone.
Rewrite titles to echo the actual top query for each page. Pull the top 3 queries for the page in GSC, find the shared intent, rewrite the title in the user's own language. Stop being clever. Be specific.
Write deliberate meta descriptions for the top 10 high-impression pages. Treat them like ad copy, not summaries. Google may rewrite them, and they affect the snippet, not the ranking.
For the position 8–15 cluster, add one internal link each. Pick your strongest existing page (by impressions in GSC) and add a contextual link to each underperformer. Internal linking is one of the levers you fully control: Google uses links to find pages and read their relative importance, though no source measures how fast it moves rankings.
Check the SERP for your top 5 queries by hand. Actually open google.com, search the query, screenshot the SERP. Count the rich features above the first organic result. In our observation, three or more leave little room for organic clicks on that query (no published threshold; test it against your own pages), so consider aiming the page at a different query.
Diagnose the mid-period drop. Compare mode in GSC, last 14 vs. prior 14, sorted by impression delta. Find the query. Decide if it's recoverable, or if it's now permanently owned by an AI Overview.
The lesson (it's a generalizable one)
Most "my SEO is broken" problems indie devs bring me are CTR problems wearing a ranking-problem costume. The reason is structural: every analytics tool reports ranking as the headline number because it's the easiest to measure, so we end up obsessing over a metric that explains a much smaller share of the click outcome than we think.
Rankings decide if you show up. Title, description, and SERP context decide if you get clicked. Both matter. In most underperforming accounts the second is the one with 5x more leftover money on the table.
If your Search Console looks anything like the chart above — big impressions, tiny clicks, position in the teens — don't go write more content. Don't go buy links. Open the high-impression / low-CTR view first. The fix is almost always smaller, cheaper, and faster than you think.